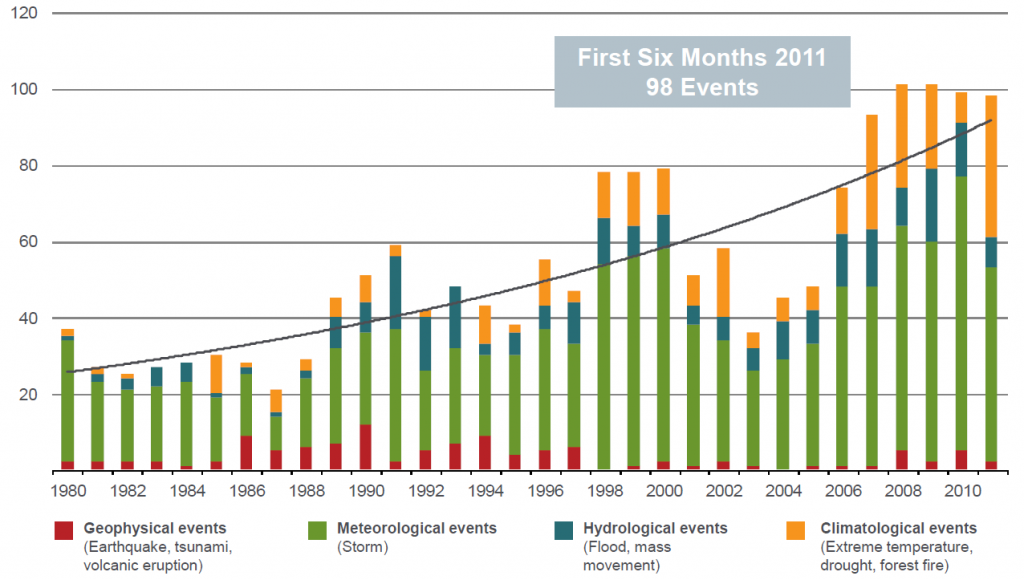
An interesting… wait… no… a terrifying chart from the re-insurance giant Munich Re. We’re all doomed. I’m just sayin’. Of course YMMV.
 What global climate change? I don’t see any global climate change here? There is no global climate change. This is not the global climate change you are looking for. Move along. Move along.


I’ve been following the issue since my days pursuing my degree in Meteorology at Penn State back in the mid-80s. I was skeptical back then, only because the science was a bit less established than it is now. But that’s what happens when science happens. And there is no doubt that anthropogenic global warming is happening.
All that said, this is NOT a chart to hold in front of your doubtful friends. In fact, it’s a terrible chart on a number of levels. First, they are events. Taken on their own, they don’t mean much. Also not known are any kind of severity of these events. What, exactly, qualifies as a weather event? Geophysical events? Now volcanic output has had observable effects on weather, but weather has never caused a volcano to erupt. And earthquakes? So this might be useful for insurance adjusters, but it is most definitely not science.
Better to stick with Michael Mann’s “Hockey Stick” diagram. Fully vetted, and yet to be falsified, try as the deniers might.
Well, your bona fides are great and I appreciate your comment. I did not post this as anything more than a data point in the ongoing discussion around global climate change. The reinsurance industry has cause for concern as global climate change impact their business.
I would disagree with you that it’s a “terrible” chart simply because it doesn’t show what you want it to show. Would you blame a pickle for not being a St. Bernard? The intent was to show the aggregate increase in claims and the type of claims that are being filed. Nothing more.
And I was attempting to make a funny. Clearly, I did not succeed. I shall now hang my head in shame…
No, I sensed the tongue-in-cheek nature of the post. And I was only half serious to suggest that I know more than the next guy. To be sure, you can lay that chart over the climatological charts and see a real correlation. And if it’s one thing insurance companies are good at, it’s taking data.
Yeah, I think of this as a dependent variable in the whole discussion and one the reinsurance industry is keenly following. You can only spread the risk so far when all of Manhattan sinks beneath the rising sea.