
Some of you may know that I love infographics.
The web has enabled the growth of interactive infographics in a way that just isn’t possible with other mediums. There have been several recent releases of visualized information from the 2010 Census results that are quite interesting. One of the ones to take a look at is the American Human Development Project of the Social Science Research Council’s Measure of America.
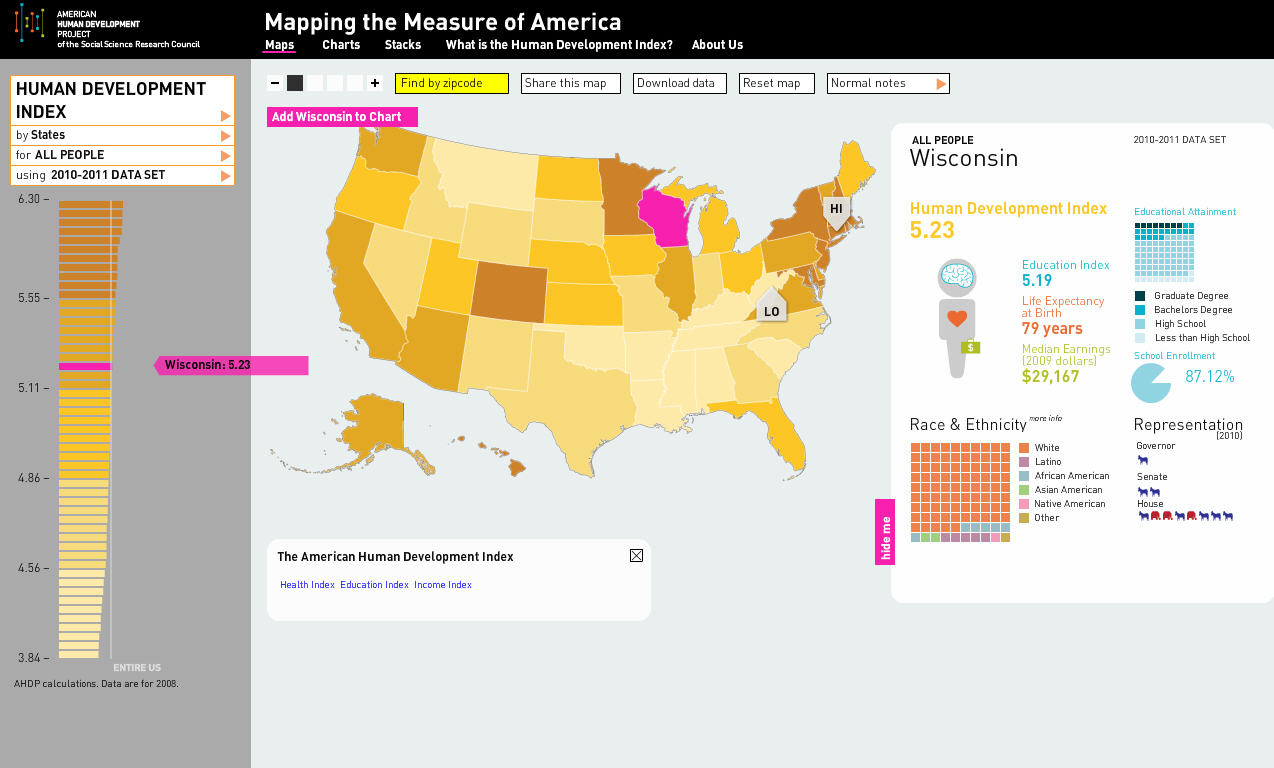
They have an interesting mapping capability that showcases the status of different geographic units around the country. Here’s a screen shot of the status of the State of Wisconsin and the link to the source data:

Meanwhile The New York Times has released access to localized census data from the US Census Bureau’s American Community Survey that allows you to select your zip code to get a demographic profile of census tracts in that area. I took the following screen shot of the Madison area with the 1701 Census tract, representing the near east side of Madison. Type in your zip code to find the profile of your census tract.

From a political perspective, it would be interesting to map the change in the Human Development Index as Scott Walker and the GOP proceed to destroy some of what gives this state its relatively high standing among the 50 states. I hope to be able to take a snap shot and report on this next year at the same time to see how the state fares once he and his minions continue their destruction of the state’s more progressive wellness and lifestyle attributes in a desire to pay back their corporate paymasters and Tea Party constituents.
It would also be interesting to overlay the census data with voting patterns – % voted, % by party, % by candidate with demographic matching to see who put Walker and the GOP into office and how the Democratic Party and progressives can take action to take their state back from the coming downfall as he drives the state over a self-created precipice.

I share your love of data visualization. But whenever I see anything like this, I can’t help but try to pick at it – not because I want to criticize everything, I just like to try & figure out whether it’s a good & accurate representation of things.
Overall, very cool. I like that you can view by congressional district and look at 2008-09 data as well. Looks like they need to do a little work on their UI for the menuing for viewing by race – really doesn’t work very well.
The one thing that jumped out at me with this one is that income data uses raw income, and that probably skews things a bit. You end up with a bit of an East Coast bias. The income data needs to be normalized in some way to factor in cost of living – because $29,000 in Wisconsin is very different than in DC, New York, etc. Heck, think about Alaska & especially Hawaii. It’s just not at all apples to apples. My guess is that $29K in Wisconsin, you might actually be better off, have a higher standard of living than earning $40K in DC.
Yes, WI is a leader in tax rates, a leader in over regulating, a leader in businesses closing shop or moving elsewhere. Hard to see how you can be oblivious to the damage done by Walker’s predecessor?
Me- I have no illusions. Will Walker walk the walk, or compromise his way to further destruction of our economy and our liberty, as so many Republicans before him?
Rumor has it that some Republicans are nervous, because they want business as usual, but are not sure what to do because so many folks like me are paying attention, AND they realize the economy is not as robust as they would like. I certainly am willing to give Walker and the new majority a chance, as time will tell if they are sincere, or if they will continue the destruction of the last 8 years, and yes, the 16 before that.