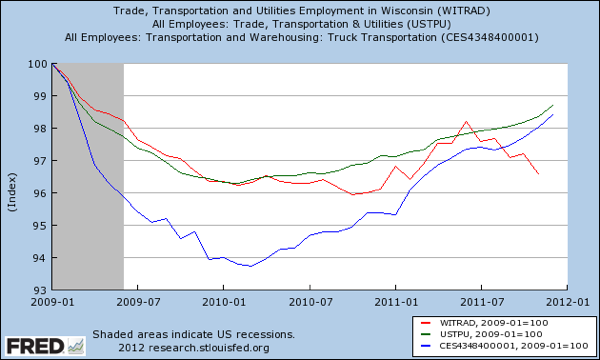
Good news for the US economy on the trucking front (not so much for Wisconsin, though):
The American Trucking Associations’ advanced seasonally adjusted (SA) For-Hire Truck Tonnage Index jumped 6.8% in December after rising 0.3% in November 2011. The latest gain put the SA index at 124.5 (2000=100) in December, up from the November level of 116.6.
For all of 2011, tonnage rose 5.9% over the previous year – the largest annual increase since 1998. Tonnage for the last month of the year was 10.5% higher than December 2010, the largest year-over-year gain since July 1998. November tonnage was up 6.1% over the same month last year.
“While I’m not surprised that tonnage increased in December, I am surprised at the magnitude of the gain,” ATA Chief Economist Bob Costello said. Costello noted that it was the largest month-to-month increase since January 2005.
“Not only did truck tonnage increase due to solid manufacturing output in December, but also from some likely inventory restocking. Inventories, especially at the retail level, are exceedingly lean, and I suspect that tonnage was higher than expected as the supply chain did some restocking during the month.” he said.

As goods begin to flow again through the arteries of the economy, it appears that demand is picking up again. This is critical to our national recovery.
More tonnage means more drivers so we can head over to our old friend, the FRED database and check the numbers for trucking employment at the national and state levels.
So what about Wisconsin? Did Wisconsin benefit from any of this increase in truck tonnage? Of course not…

This chart compares the datasets that includes trucking at the national and Wisconsin state levels (Trade, Transportation & Utilities or TTU). While this is a superset, it demonstrates a general trend in the employment of these sectors. Wisconsin, the red line, is headed in the wrong direction. I can add the national trucking only index (All Employees: Transportation and Warehousing: Truck Transportation) to the chart to provide a directional sense of what’s happening with trucking.

The huge dip in the blue line following the 2008/2009 recession reveals a precipitous drop in agregate national demand via this core trucking metric. But that line is climbing sharply as we move into 2012 and visually correlates nicely with the chart from the ATA on truck tonnage.
Unfortunately for Wisconsin, the red line (which, remember is analogous to the green national TTU line) is headed in the opposite direction. Quite obviously, the sector which is a good indicator of economic improvement is passing us by here in the Badger State.
Unfortunately, it’s not working here in Wisconsin.


Recent Comments